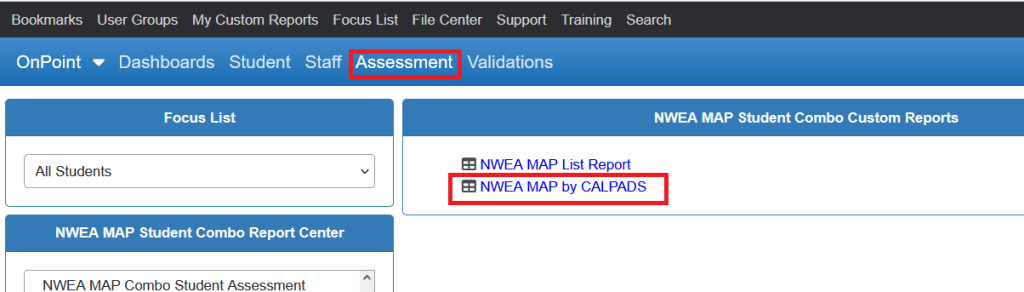
OnDataSuite can cross-tabulate your MAP student data to your CALPADS data to provide a calculated percentage of passers by district and campus for RIT Score Averages, Percentile Averages, Average Observed Growth, MET/Not Met counts, Met Projected Counts and Student Overall Met Projection Counts.
- All Students
- Economic Disadvantaged
- At Risk
- ESL Native
- Ethnicity
- Special Ed
- Special Ed Former
- LEP Continuously Enrolled
- LEP Non-Continuously Enrolled
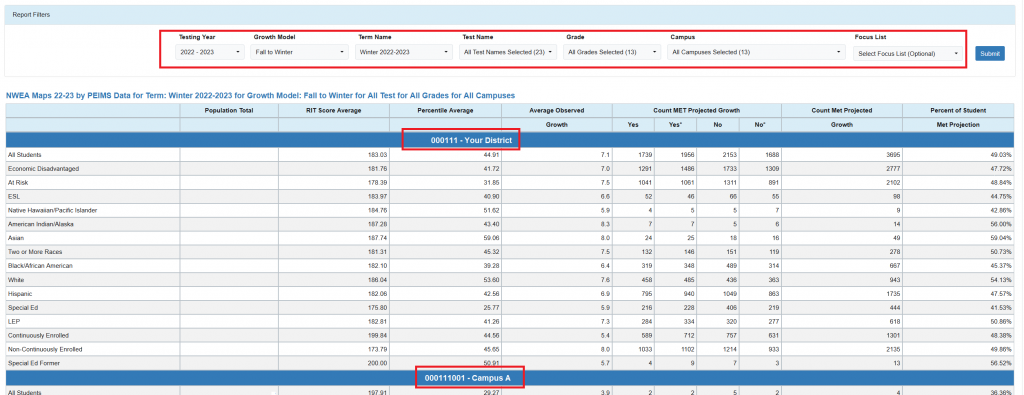
This report associates student MAP assessment data to student demographic data in CALPADS
- Population Total – Derived from CALPADS
- RIT Score Average – Average (MAP Field – Test RIT Score)
- Percentile Average – Average (MAP Field – Test Percentile)
- Average Observed Growth – Average (MAP Field – Observed Growth)
- Count MET Projected Growth Yes – Count (MAP Field – Met Projected Growth = ‘Y’)
- Count MET Projected Growth *Yes – Count (MAP Field – Met Projected Growth = ‘*Y’)
- Count MET Projected Growth No – Count (MAP Field – Met Projected Growth = ‘N’)
- Count MET Projected Growth *No – Count (MAP Field – Met Projected Growth = ‘*N’)
- Count MET Projected Growth – Count (MAP Field – Met Projected Growth = ‘Y’ and ‘*Y’)
- Percent of Student Met Projection shown below
Calculation Sum ( ‘Y’+’*Y’) / Sum ( ‘Y’+’*Y’+’N’+’*N’)
Make sure to filter appropriately
If your report is not populating all of the display columns, make sure that your filtered selections are correctly associated according to the MAP year, growth model, and term name.
Required File Uploads
To utilize this report users will need to upload MAP data.
Loading NWEA MAPS data