
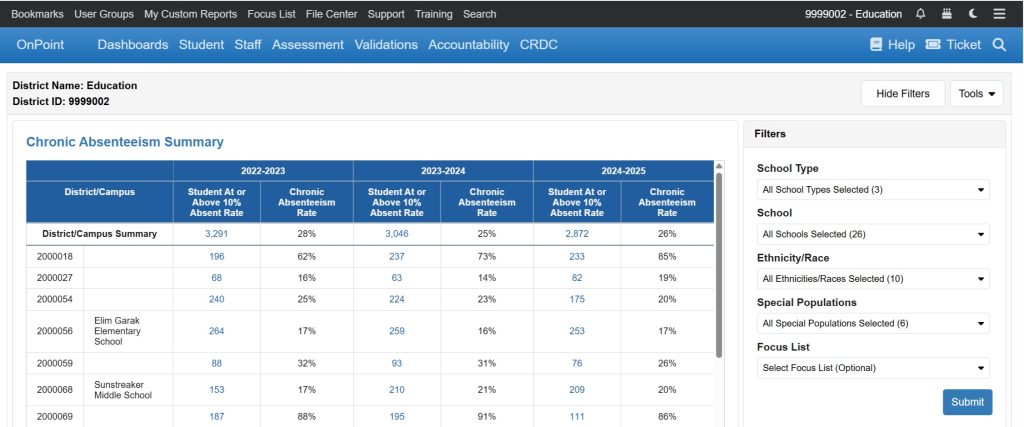
The Chronic Absenteeism Summary report provides an overview of student attendance patterns and identifies students who meet the criteria for chronic absenteeism.
📍 Where to Find This Report: Student<Attendance reports
A student is considered chronically absent if they miss 10% or more of the total school days enrolled, for any reason (excused or unexcused).
The Chronic Absenteeism Summary report identifies students who have missed 10% or more of school days (chronically absent) and tracks the district’s chronic absenteeism rate over multiple academic years. Results are presented by campus with year-over-year trend columns, making it easy to spot patterns and target intervention efforts.
🧭 Data Sources: CALPADS
📑Key Points
- Chronic absenteeism is calculated as:
Days Absent ÷ Days Enrolled ≥ 10% - Both excused and unexcused absences are included in the calculation.
- Students must have valid enrollment and attendance records during the selected reporting period to be included.
- Attendance data is derived from the local Student Information System (SIS) and reflects the information loaded into OnDataSuite.
🎛 Filter Options
| School Type | Narrows the School list to schools of the chosen type (e.g., Elementary, Middle, High School). Changing this filter automatically updates the available schools in the School filter. | Required |
| School | One or more campuses to include. The list is dynamically filtered by the School Type selection above. Displays the campus ID and name. | Required |
| Ethnicity / Race | Limit results to students of the selected race/ethnicity groups as reported in CALPADS. | Required |
| Special Populations | Filter by one or more designated student groups:English LearnersLong-Term English LearnersSocioeconomically DisadvantagedStudents with DisabilitiesFoster StudentsHomeless Students | Required |
| Focus List | Optionally restrict the report to a saved Focus List of specific students. Select Default to include all students matching the other filters. |
Suggested Uses
- Monitor campus and district attendance trends
- Identify students at risk of chronic absenteeism
- Support intervention programs and attendance improvement plans
- Review attendance patterns by subgroup, grade, or school
Student Drilldown
Clicking a student count in the report opens a detailed student roster for that school and year. The following fields are displayed per student:
- Local Student ID
- First, Middle, and Last Name
- School of Attendance
- Grade Level
- Gender
- Ethnicity / Race
- Attendance Rate
- Absenteeism Rate
- English Language Acquisition Status
- Long-Term English Learner designation
- Socioeconomically Disadvantaged designation
- Student with Disabilities designation
- Foster Care designation
- Homeless designation
Important Notes
- Students with incomplete enrollment or attendance data may not appear in the report.
- Attendance totals and percentages are based on the data available in OnDataSuite at the time the report is generated.
- Variances may occur if attendance corrections are made in the SIS after the data was loaded.