
📍 Where to Find This Page
Student Profile → Assessments → Acadience Math
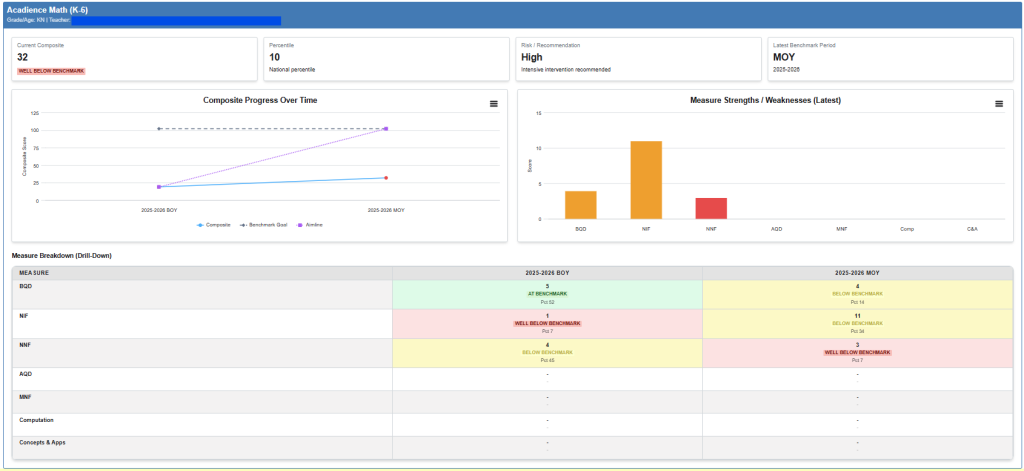
The Acadience Math Assessment Results page provides a detailed view of an individual student’s mathematics benchmark performance. The page displays composite scores, national percentile rankings, instructional risk levels, benchmark growth, and detailed results for individual mathematics measures to help educators monitor student progress and identify instructional needs.
👤 What this Page Shows
The Acadience Math Assessment Results page displays:
- Student and assessment information
- Current composite score
- Benchmark performance level
- National percentile ranking
- Instructional risk classification
- Most recent benchmark period
- Composite growth over time
- Performance across individual mathematics measures
- Benchmark status and percentile rankings for each measure
Together, these results provide a comprehensive view of a student’s foundational mathematics skills and progress toward grade-level benchmarks.
💡 Suggested Uses
The Acadience Math Assessment Results page helps educators:
- Monitor mathematics growth throughout the school year.
- Identify students who may benefit from intervention or additional instructional support.
- Review benchmark performance across multiple assessment windows.
- Compare student performance to national norms.
- Identify strengths and weaknesses in foundational mathematics skills.
- Evaluate progress toward benchmark goals.
- Prepare for intervention meetings, MTSS discussions, and parent conferences.
🧭 Data Sources
The Acadience Math Assessment Results page displays information imported into OnDataSuite from Acadience Math assessment files.
The information displayed depends on:
- The assessment windows completed by the student.
- The student’s grade level.
- The assessment measures administered during each benchmark period.
Teacher information displayed on the page reflects the student’s assigned teacher at the time of the assessment.
📑 Visuals and Data Views
The page is organized into several information panels.
Dashboard Summary
The top of the page displays summary information, including:
- Student name
- Grade level
- Teacher
- Assessment program information
It also displays the student’s:
- Current Composite Score
- Composite Performance Level
- National Percentile
- Instructional Risk Level
- Latest Benchmark Period
Composite Progress Over Time
This chart displays student growth across benchmark assessment windows.
The chart may include:
- Student Composite Scores
- Benchmark Goal
- Aimline (expected growth trajectory)
This visualization helps educators determine whether the student is progressing toward grade-level benchmark expectations.
Measure Strengths / Weaknesses
This chart provides a visual comparison of the student’s performance across individual Acadience Math measures, making it easier to identify areas of relative strength and areas that may require additional instruction.
Measure Breakdown
The Measure Breakdown section provides detailed benchmark results for each mathematics measure.
Depending on grade level, measures may include:
- Basic Quantity Discrimination (BQD)
- Next Number Identification Fluency (NIF)
- Next Number Fluency (NNF)
- Advanced Quantity Discrimination (AQD)
- Missing Number Fluency (MNF)
- Computation
- Concepts & Applications
For each measure and benchmark period, the page may display:
- Score
- Benchmark Status
- National Percentile Ranking
The measures displayed vary based on the student’s grade level and the assessments administered.
📊 How to Interpret this Page
The composite score provides an overall measure of the student’s mathematics proficiency based on the Acadience Math assessment.
Benchmark performance levels indicate how the student’s performance compares to grade-level expectations.
Performance levels include:
- Above Benchmark – The student is performing above grade-level expectations.
- At Benchmark – The student is meeting grade-level expectations.
- Below Benchmark – The student may benefit from additional instructional support.
- Well Below Benchmark – The student may require intensive intervention and progress monitoring.
National percentile rankings compare the student’s performance to a national sample of students in the same grade.
The instructional risk level provides additional guidance regarding the amount of support a student may need:
- Low Risk – Student is performing at or above benchmark expectations.
- Moderate Risk – Student may benefit from additional instructional support.
- High Risk – Student may require targeted intervention and ongoing progress monitoring.
Because available measures vary by grade level and benchmark window, not every student will have results for every assessment measure. Blank fields indicate that a measure was not administered or that no score was available during the selected benchmark period.
🔗 Related Articles & Helpful Reports
- Student Profile – Overview
- Acadience Reading Assessment Results
- Acadience PELI Assessment Results
- Amplify DIBELS Assessment Results
These related articles provide additional information about complementary literacy and mathematics assessments available within the Student Profile.